Dançando no escuro
“Trabalhe como se não precisasse de dinheiro. Ame como se nunca tivesse sido magoado. Dance como se ninguém estivesse vendo.” – Satchel Paige
Todas as noites, um monte de objetos celestes – pequenos e grandes – dançam ao som da silenciosa melodia da gravidade. Na escuridão do espaço além de Netuno, um grupo de objetos do Cinturão de Kuiper (Kuiper Belt Objects, KBOs) dançam como se ninguém estivesse vendo – até agora.
Eles dançam lentamente, pois os objetos do Cinturão de Kuiper levam séculos para completar uma órbita. Esses KBOs, cada um com tamanho da ordem de centenas de quilômetros, foram descobertos pelo DES ao longo dos últimos dois anos e meio (um deles foi descrito nesse blog num post anterior). Vamos supor que você desconheça a existência da gravidade. O que você deduziria de um padrão como o apresentado no video? Como explicar isso? As leis que regem essas complicadas danças celestiais devem ser muito complicadas, certo?
Os povos antigos demarcavam o passeio dos planetas no céu de noite em noite e de estação em estação do ano. Eles perceberam que os planetas se moviam de uma maneira diferente: algumas vezes eles pareciam parar, virar, e se mover na direção contrária da abóboda celeste, até virarem novamente e seguirem seu rumo. Modelos engenhosos foram criados para explicar essa dança complicada. Mas eles se tornavam cada vez mais complicados, e pior, não conseguiam descrever observações mais modernas e precisas.
Duas revoluções científicas – primeiro com Copérnico e depois com Newton – foram necessárias para mostrar que o movimento planetário podia ser explicado por uma simples equação, a lei da gravitação. De repente o padrão obscuro ficou claro.
A pirueta graciosa executada pelos KBOs é produzida pela combinação de dois movimentos. A órbita centenária produz um lento deslocamento para leste que o leva ao longo de um campo da DECam por ano. Mas nós observamos esses objetos a partir de uma plataforma em movimento, o planeta Terra. A medida que a Terra segue em sua jornada em volta do Sol, observamos o KBO de diferentes perspectivas, algumas vezes a 150 milhões de quilômetros de distância de um lado do Sol, seis meses mais tarde, à mesma distância do outro lado do Sol, e em outras épocas de algum lugar entre estes dois extremos. O movimento resultante é um vai-e-vem relativo às estrelas distantes que servem como pano de fundo para a órbita do KBO. Para ter uma idéia melhor, enquanto gira sua cabeça de um lado para o outro, observe como a ponta do seu dedo se move em relação à objetos no fundo do seu campo de visão.
Um objetivo da Física é extrair ordem da complexidade, explicar uma grande variedade de fenômenos com um pequeno conjunto de leis simples. Com o tempo, físicos perceberam que a lei da gravitação de Newton falhava em algumas situações e precisava ser substituída pela Teoria da Relatividade Geral de Einstein.
Hoje em dia, a gravidade confronta nossa geração com um novo quebra-cabeça de grandes proporções: Por que a expansão do universo está acelerada ? Talvez alguma nova lei irá explicar o mistério da energia escura e a dança dos planetas com a mesma elegância e simplicidade. Essa é a esperança que mantém nossos detetives da energia escura olhando pacientemente para cima.
Det. Dave Gerdes [Universidade de Michigan]
Tradução: Det. Ricardo Ogando e Det. Flávia Sobreira
Dancing in the dark
“Work like you don’t need the money. Love like you’ve never been hurt. Dance like nobody’s watching.”–Satchel Paige
To the silent tune of gravity, congeries of celestial objects – big and small – dance each night away. In the darkness beyond Neptune, this troupe of Kuiper Belt objects (KBOs) had been dancing like no one was watching – until now.
Their dance is a slow one, for Kuiper Belt objects take centuries to complete one orbit. These KBOs, each a few hundred kilometers in size, have been discovered by DES over the last two and a half years. (One of them was described here earlier.) Suppose you knew nothing about gravity. What would you make of a pattern like this? How would you explain it? The laws that give rise to such intricate celestial swirls must be incredibly complicated, right?
Ancient people marked the wanderings of the planets from night to night and season to season. They noticed that they moved across the sky at wildly different rates: sometimes, they appeared to stop, turn around, and move backwards against the canopy of fixed stars, before turning again and resuming their course. Ingenious models were developed to explain this complicated dance. But they became increasingly unwieldy, and even worse, failed to describe new and more accurate observations.
It took two scientific revolutions—first from Copernicus and then from Newton—to show that planetary motion could be readily explained by a single simple equation, the law of gravitation. The hidden pattern suddenly became clear.
The graceful pirouette executed by a KBOs arises from a combination of two motions. Its centuries-long orbit produces a slow eastward drift that carries it about the width of one DECam field of view per year. But we observe these objects from a moving platform, planet Earth. As the earth makes its journey around the sun, we observe the KBO from different perspectives, sometimes from 150 million kilometers on one side of the sun, six months later from 150 million kilometers on the other, and at other times from somewhere in between. This results in an annual back-and-forth motion relative to the distant stars that’s superimposed on the KBO’s own orbital motion. Watch how your fingertip moves against background objects when you move your head from side to side and you’ll get the idea.
Physics aims to distill order from complexity, to explain the vast array of natural phenomena with a small number of simple laws. Eventually, physicists learned that Newton’s law of gravitation fell short in certain situations and needed to be superceded by Einstein’s theory of general relativity.
Today, gravity confronts our generation with a new puzzle on the grandest of scales: Why is the expansion of the universe accelerating? Perhaps some new law will explain the mystery of dark energy with the as much elegance and simplicity as the dance of the planets. That’s the hope that keeps our dark energy detectives patiently looking up.
Det. Dave Gerdes [University of Michigan]
Sopa cósmica para a alma
Cercado por forças e energias ocultas aos olhos mas que trabalham ativamente no cosmos, um fogo arde… fervendo uma sopa.
A história de expansão do Universo é dominada pela matéria escura e energia escura. Entretanto, são os elementos na tabela periódica que nos permitem estudar e compreender essa história. Nesse artigo damos um gostinho de como a sopa cósmica de elementos surgiu.
Quase todos os elementos apareceram dentro dos primeiros 30 minutos após o Big Bang. O caldo resultante era um pouco “insosso”: 9 núcleos de hidrogênio (um próton) para um núcleo de hélio (dois prótons) e quase mais nada do resto. Você teria que caçar muito, através de bilhões de núcleos, para encontrar um delicioso “naco” de lítio (três prótons).
Felizmente, ao longo dos últimos 13,7 bilhões de anos, a sopa cósmica levou um pouco mais de tempero. A fusão nuclear – tão inatingível na Terra – é corriqueira nas estrelas: temos que agradecer à fusão nuclear pelo carbono em nossas células, pelo ferro em nosso sangue.
O sabor, densidade e temperatura da sopa de elementos varia bastante. Veja o nosso sistema Solar por exemplo: das pressões e temperaturas extremas no núcleo do Sol, ao frio e o vazio do espaço que cerca os planetas. Essas variações se repetem por toda a Via-Láctea e em todas as outras galáxias no universo também.
Esses três conceitos – que todos os elementos se formaram logo após o Big Bang; que uma pequena quantidade de elementos pesados foi adicionada deste então; e que os elementos são distribuídos de forma heterogênea – são de grande utilidade para o Dark Energy Survey.
Veja por exemplo os aglomerados de galáxias, como os que estão no video acima (e descrito em detalhes mais tarde). Essas estruturas são tão grandes que podem ser consideradas mini Universos. Aglomerados contem várias dezenas de galáxias, às vezes até centenas. No espaço entre as galáxias habita uma tênue neblina de gás.
Tanto o gás quanto as galáxias estão presas dentro das fronteiras do aglomerado pela matéria escura. A matéria escura atua como a tampa em uma panela, assim como a tampa impede que a água na panela evapore toda rapidamente, a matéria escura impede as galáxias – as quais estão se movendo a milhões de quilômetros por hora – de fugir. Entretanto, nas bordas dos maiores aglomerados, a energia escura compete com a gravidade e as galáxias começam a escapar. É essa interação entre gravidade e energia escura que faz com que aglomerados de galáxias sejam tão úteis para estudos cosmológicos.
As partículas do gás em aglomerados são tão quentes que elétrons (carga negativa) e núcleos (carga positiva) são separados um do outro (opostos se atraem) – essa forma de gás é conhecida como plasma. O plasma brilha intensamente na parte do espectro eletromagnético conhecida como raio-X e pode ser detectada por satélites como XMM-Newton e Chandra. Esse plasma também produz uma sombra sobre a Radiação Cósmica de Fundo (um pulso de luz emitido por todo o Universo uns cem mil anos após o Big Bang), o que significa que ele também pode ser detectado em radio-telescópios tais como o South Pole Telescope.
Diferentemente do gás, os elementos presos em estrelas são mais frios, e em densidades muito maiores, emitem luz visível. A luz das estrelas permite que o Dark Energy Survey não apenas detecte milhares de aglomerados, mas também meça suas distâncias (através de uma técnica conhecida como “desvio para o vermelho fotométrico”), e faça uma primeira estimativa de suas massas. Essas massas precisam ser refinadas antes de serem usadas em estudos cosmológicos, e observações do plasma feitas por telescópios no raio-X e rádio são fundamentais para isso.
No vídeo acima mostramos alguns exemplos das centenas de aglomerados do Dark Energy Survey que também foram observados pelo levantamento XMM-Newton Cluster Survey. A intensidade da emissão em raio-X vinda do plasma quente é indicada pelos contornos vermelhos. Especialistas em raio-X estão trabalhando com esses dois conjuntos de dados para calibrar as massas dos aglomerados do Dark Energy Survey.
Finalmente… porque “para a alma”? Bom, “alma” pode ser um sinônimo de “quintessência”, e a Quintessência foi um termo adotado por muitos cosmólogos para descrever genericamente teorias que permitem que as propriedades da Energia Escura varie com o tempo.
Det. Kathy Romer [Universidade de Sussex]
Créditos da Imagem: Det.’s Phil Rooney [Universidade de Sussex] e Chris Miller [Universidade de Michigan]
Trad. Det. Ricardo Ogando
Cosmic soup for the soul
Amidst the dark forces and energies at work across the cosmos, a fire brews, a soup simmers.
The expansion history of the Universe is dominated by dark matter and dark energy. However, it is the elements in the periodic table that allow us to study and understand that history. In this posting we give a flavor for how the cosmic soup of elements came into existence.
Almost all the elements came into existence within 30 minutes of the Big Bang. The resulting broth was rather dull: 9 hydrogen nuclei (one proton) to every helium nucleus (two protons) and almost nothing of anything else. Even if you sifted through a billion nuclei you’d still be lucky enough to find anything as tasty as lithium (three protons).
Fortunately, over the intervening 13.7 billion years, the cosmic soup has become a little more interesting. Nuclear fusion – so hard to reproduce on Earth – is common place in stars: we have fusion to thank for the carbon in our cells, to the iron in our blood.
The flavor, density and temperature of the element soup varies widely. Consider our own Solar system: from the extreme pressures and temperatures inside the Sun’s core, to the cold and empty space between the planets. These variations are replicated throughout the Milky Way and in all the other galaxies in the universe.
These three concepts – that most elements were formed just after the Big Bang; that a smattering of heavier elements have been added since then; and that the elements are distributed non-uniformly – are of great benefit to the Dark Energy Survey.
Take for example clusters of galaxies, like those in the slideshow above (described in more detail later). These structures are so enormous that they can be considered to be mini Universes in their own right. Clusters contain several dozen galaxies, and sometimes as may as several hundred. In between the galaxies is the continuous haze of tenuous gas.
Both the gas and the galaxies are trapped within the confines of the cluster by dark matter. The dark matter acts like the lid on a sauce pan, where the lid stops the pan boiling dry, the dark matter stops the galaxies – which are moving at more than a million miles per hour – from flying away. However, at the outer edges of the very largest clusters, dark energy competes with gravity and the galaxies are starting to be peeled away. It is this interplay of gravity and dark energy that make clusters such useful cosmological probes.
The particles in the gas are so hot that electrons (negatively charged) and nuclei (positively charged) are stripped apart – this form of gas is known as a plasma. The plasma shines brightly in the X-ray part of the electromagnetic spectrum and can be detected by satellites such as XMM-Newton and Chandra. The plasma also casts a shadow on the Cosmic Microwave Background (a pulse of light that was emitted throughout the Universe one hundred thousands years after the Big Bang), meaning it can also be detected with shortwave radio telescopes such as the South Pole Telescope.
By contrast, the elements trapped in the stars are cooler, and at much higher densities, and shine in visible light. Starlight allows the Dark Energy Survey to not only to detect hundreds of thousands of clusters, but also to measure their distances (via a technique known as photometric redshifts), and to make a first estimate of their masses. Those masses need to be refined before we can use the clusters for cosmology, and information of the plasma from X-ray and radio telescopes is essential for that.
In the slideshow above we show several examples of the hundreds of Dark Energy Survey clusters that have also been observed by the XMM-Newton Cluster Survey. The intensity of the X-ray emission coming from the hot plasma is indicated by the red contours. X-ray specialists are working with these two datasets to calibrate the masses of Dark Energy Survey clusters.
Finally… why “for the soul”? Well “soul’’ happens to be a synonym for “quintessence”, and Quintessence has been widely adopted by cosmologists as a catch all term to describe theories that allow for a time variation in the properties of Dark Energy.
Det. Kathy Romer [University of Sussex]
Image Credit: Det.’s Phil Rooney [University of Sussex] and Chris Miller [University of Michigan]
巡天遥看一千河
地球相对于天空来说,约每24小时自转一周。地球上的我们也因此做到了“巡天”的旋转木马上。
每到傍晚,离我们最近的恒星,太阳,就会撤走遮天幕地的光芒。呈现给我们的将是一闪一闪宛如跳舞般的星光——那些古老遥远的星系和星星遍布了整个夜空。傍晚之后的几个小时给予我们机会细致观察笼罩着地球的点点星光,直到天色微曦,我们再次沐浴到阳光下。白天的时候,满天星斗依然存在,但强烈的阳光让我们几无可能观察到它们。一直到夕阳西下,那些跳舞般闪亮的星系和星星准时回到夜幕这张大舞台上,星空再次出现。
我们的整个太阳系都是银河星系的一部分。银河系呈盘状,其中的星星和气体物质又组成了银心和旋臂。我们的地球作为附属于太阳的一个淡蓝色小点,住在银河系的郊区,银盘的二分之一处。当地球日复一日的自转时,银河系也在缓慢的旋转,但银河系的旋转周期要比地球长的多。
在天空日复一日,夜复一夜的旋转中,银河系的平面也和其他星系、星星一起一遍遍经过我们上方的天空。当我们从伸手不见五指的帕穹山(Cerro Pachon)山顶向天空望去的时候,我们可以看到银河系的平面,看到银河系中心所在的方向。
在本页的视频中,相机经南由东向西移动,整晚每隔三十秒进行一次拍摄。地球的自转轴经过南极点,所以我们可以看到天空绕着向南的方向旋转:银河系的一边先落下,然后在这个十月凌晨一点的时候,另一边开始升起。
晚上好,欢迎和我们一起,“巡天”遥看一千河。
作者:暗能量侦探 B · 诺德 (B. Nord)
视频制作:暗能量侦探 B · 诺德 (B. Nord)
翻译:暗能量侦探 张Y (Y. Zhang)
翻译编辑:暗能量侦探 李T (T. Li)
备注:
- 本博文引用的视频设制于帕穹山。其时,作者正在使用双子南座望远镜(坐落于帕穹山,Cerro Pachon)为暗能量巡天所发现的伴有强引力透镜现象的星系团进行后续观测,并非用布兰科望远镜(托洛洛山,Cerro Tololo)进行暗能量巡天项目的直接观测。 帕穹山和 托洛洛山的地理位置极其接近。
- 翻译的博文标题取自毛泽东《送瘟神》。
As the sky turns: the fall and rise of the Milky Way
We are swept up in a cosmic merry-go-round.
Earth spins relative to the sky – about one revolution every 24 hours.
After twilight, our nearest star, the Sun removes its warm blanket of light, revealing the dancing lights overhead: collections of aeons-old galaxies and constellations of distant stars fill the night sky. For some precious hours, we have exquisite access to these pinpricks and smudges of light that have always swirled overhead – until we bask again in the Sun’s rays. During the day, all blinking tapestry is still above us, but the Sun washes out any hope of seeing it. Again, after dusk, familiar patterns fill the sky, as the dancers return like clockwork to their positions on the celestial stage.
Our entire solar system resides in a galaxy, the Milky Way. The Galaxy’s structure includes spiral arms and a disk of stars and gas: our pale blue dot, tethered to the Sun, is nestled in the suburbs, halfway to the edge of the Galactic disk. As we turn from day to night to day, the Galaxy itself also spins (over much longer periods than Earth’s day).
During the course of our daily/nightly sweep of the heavens, just as the stars and galaxies move across our sky, so does the disk of Milky Way. When we look up from the dark mountain tops of Cerro Pachon, we look into the plane of the Milky Way, into the heart of our Galaxy.
In the video above, the camera rotates from East to West through South – taking a picture every 30 seconds over the course of the night. Earth’s axis goes through the South pole, so we see the sky spin about that point: one side of the Milky Way sets, and by 1am on this October night, another side begins to rise.
Good night, and keep looking up,
Det. B. Nord
Virando a noite mundo afora
Semana passada, detetives do DES fizeram ações coordenadas em vários continentes para reunir evidências de como o tecido do espaço-tempo está se expandindo.
Em Sussex, Inglaterra, cerca de 100 detetives se encontraram para discutir o estado atual e futuro do levantamento sendo conduzido no telescópio Blanco, localizado em Cerro Tololo, Chile. Nesse encontro semestral da colaboração (sempre em um lugar diferente), continuamos a planejar novas estratégias para “enquadrar” a evolução do espaço-tempo e energia escura: na verdade, enquanto escrevo essas linhas, vários resultados preliminares estão se preparando para vir a público.
Enquanto isso em Cerro Tololo, um time de observadores operava a Câmera da Energia Escura (DECam) no telescópio Blanco, caminhando em direção ao fim da segunda temporada de observações do levantamento. Cada temporada vai de Agosto a Fevereiro, aproveitando o verão Chileno.
No Telescópio Anglo-Australiano no Observatório Siding Spring na Australia, temos o lar do Levantamento OzDES – um projeto para obter medidas de distâncias altamente precisas de objetos descobertos pelo DES, tais como supernovas e aglomerados de galáxias. Essas “diligências” fora do DES são importantes para ajudar a montar o perfil da energia escura.
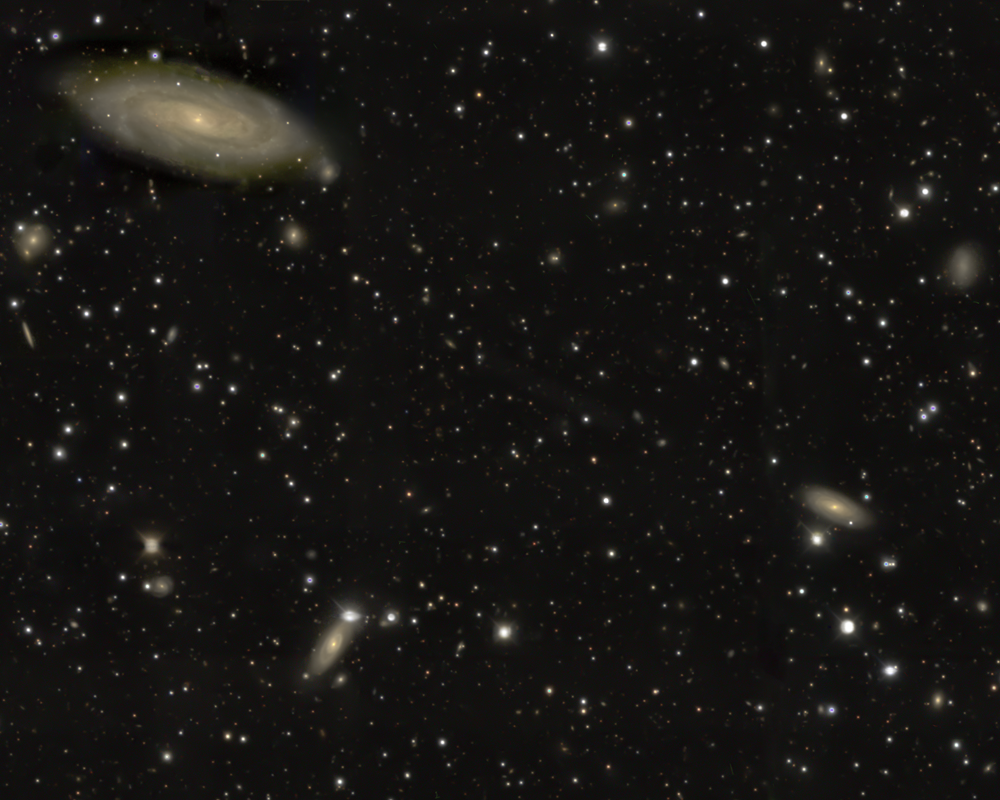
Já em Cerro Pachon, ao lado de Cerro Tololo, dois agentes começaram a procurar por evidências de desvios no espaço-tempo, usando o Telescópio Gemini Sul (@GeminiObs). Foram seis noites de trabalho para medir com grande acurácia a distância de sistemas de lentes gravitacionais fortes. Esses sistemas são galáxias ou grupos de galáxias que tem massa o suficiente para distorcer o tecido do espaço-tempo. A distorção é tão grande que raios de luz provenientes de galáxias e quasares que estão atrás desses sistemas se curvam. O resultado em imagens da DECam é a aparição de múltiplas fontes ou fontes distorcidas, tal qual em uma lente óptica. Nos próximos relatórios apresentaremos mais detalhes sobre essas evidências.
Nesse meio tempo, supercomputadores do Centro Nacional de Aplicações de Supercomputação (NCSA) estão processando na calada da noite (e do dia) os dados da DECam, transformando imagens em dados refinados – prontos para a análise dos times científicos.
A imagem acima não mostra nenhuma forte evidência de lentes fortes, mas é um exemplo do exemplar conjunto de evidências que o DES continua a acumular a cada noite.
Eis as posições de algumas das galáxias acima. Que informações você pode levantar sobre elas? Existem várias ferramentas na internet que podem te auxiliar nessa investigação (por exemplo, http://ned.ipac.caltech.edu/forms/nearposn.html; tome cuidado com o formato das posições ao entrar, use como abaixo). Tuíte seus achados para nossos agentes em @darkenergdetec, e podemos comparar nossas anotações.
RA: 304.3226d, Dec: -52.7966d
RA: 304.2665d, Dec: -52.6728d
RA: 304.0723d, Dec: -52.7044d
Boa noite, e olho vivo,
Det B. Nord
Imagen: Det M. Murphy
Tradução: Det. Ricardo Ogando
Unsung Hero Cold Cases – The Slipher File
As the Milky Way sets, light from nearby villages and mining towns turns the stream of clouds overhead into a rippling river of fool’s gold. On this night in October of 2013, during the first season of observations of the Dark Energy Survey, we pumped caffeine into our bodies to stay awake, to keep ready for when the conditions would change. Every field we can observe, every galaxy we can capture will make a contribution to the greater measurement of their vast patterns – patterns distorted (or created) by a dark energy.
One hundred years ago, an American astronomer by the name of Vesto Slipher became the first to measure streams of galaxies in our local neighborhood. Slipher used the 24-inch telescope at Lowell Observatory to measure velocities of spiral nebulae (i.e., galaxies), through a method known as “spectroscopy.” Most of the galaxies that Slipher measured are receding from the Milky Way, rather than moving toward it – the first indication of cosmic expansion.
This result laid the groundwork for the definitive discovery of the expanding universe. Unfortunately, Edwin Hubble of Mount Wilson is most often accredited with this finding. Hubble measured distances via Cepheid Variables to distant nebulae and then correlated them with Slipher’s velocity (redshift) data to create the famous distance-velocity plot for his 1929 paper.
Hubble provided no citation of Slipher’s work.
Slipher is the first to measure Doppler Shifts (velocities) of galaxies, to show that spiral galaxies rotate, and to detect that collections of stars and dust are actually nebulae outside our own Milky Way.
Let us remember Vesto Slipher – among modern cosmology’s most influential unsung heroes.
Det. B. Nord
遥远的旅者

经过一段漫长的旅程,一个躲藏已久的太阳系成员终于再次回到我们“身边”。上一次这个小小的冰雪星球出现在外太阳系的时候,时间还是公元九世纪,查理曼还当着神圣罗马帝国的皇帝,中国正处于大唐盛世。
这个遥远的旅者是暗能量巡天发现的第一批柯伊伯带(Kuiper Belt)成员中的一个,现在已被正式标注为2013 TV158. 它于2013年10月14日首次进入暗能量巡天的视野。随后的十个月内,它在牛顿引力定律为它决定的轨道上缓慢前行,并被暗能量巡天观察了几十次。我们可以在本页左边的动画中看到这颗小天体移动。组成这一动画的两张影像是在2014年8月摄制,间隔两个小时。
2013 TV158 需要1200年才能绕太阳一周。它也许不过只有几百公里宽,和美国大峡谷(Grand Canyon)的长度差不多。
再过八年,它就会到达它距太阳最近的一点——即使这样,它也不会比海王星离太阳更近,距离海王星也还有几十亿公里。在这个距离上,太阳的亮度不及在地球上的千分之一,大小和一个一角硬币差不多——而且这个硬币还被置于三十米外。2013 TV158上的正午也不过如此。
在此之后,2013 TV158就要开始长达六个世纪的远离太阳之旅。慢慢地,即使世界上最先进的望远镜也会观察不到它。在它于27世纪再次向着太阳踯躅朝圣之前,它要先旅行到距离太阳300亿千米的远日点。
2013 TV158和其他数不清的小星球一样,栖息于太阳系边缘的冰天雪地。这些小天体所在的区域被称作柯伊伯带。柯伊伯带比火星和木星之间的小行星带宽20倍,重许多倍。矮行星冥王星也是柯伊伯带的成员。右下图给出了木星,冥王星和2013 TV158的轨道对比。
科学家们认为这些柯伊伯带天体(Kuiper Belt Object,简称KBO)是太阳系形成时期的遗迹,是未能成功结合成大行星的残渣碎屑。研究 这些天体可以帮助我们了解45亿年前太阳系诞生的物理过程。
由于过于遥远和暗淡,柯伊伯带天体的发现极其困难。第一个柯伊伯带天体,冥王星,发现于1930年。足足62年之后,第二个柯伊伯带天体才被发现。时至今日,已知的柯伊伯带天体只有约1500个。相较之下,火星和木星之间的小行星带已有50多万的天体被天文学家们发现。
暗能量巡天致力于远观银河系以外的数百万个星系和超新星以研究宇宙的加速膨胀,但我们可做的不止于此。暗能量巡天在每年的八月到次年的二月之间会对十个天空区域每周进行重复观察。这些观察对于寻找柯伊伯带天体非常有利。柯伊伯带天体运动十分缓慢,大概在几周甚至几个月内,它们都会出现在暗能量巡天的同一视场内。这有利于我们寻找在不同夜晚出现于不同位置的同一天体,并最终串联起几个月的观察结果以确定它们的轨道。
暗能量巡天对于柯伊伯带天体的搜寻只进行了不到百分之一,谁知道下一个进入我们视野的惊喜又会是什么样子的呢?
作者:暗能量侦探 D · 格德斯 (D. Gerdes)
翻译:暗能量侦探 张Y (Y. Zhang)
翻译编辑:暗能量侦探 李T (T. Li)
Revolution
When is the last time you watched the sky revolve around us?
Earth rotates on its axis at 1,000 miles per hour (1600 kilometers per hour). At the same time, it flies around the sun at 67,000 m/h (110,000 km/h). And the Sun, with all its planets and rocks and dust in tow, makes its way around the center of the Galaxy, our Milky Way, at 520,000 m/h (830,000 km/h). And then, the Milky Way itself is hurtling toward the nearby Andromeda galaxy at 250,000 m/h (400,000 km/h).
The fastest space craft (and fastest man-made object in history), Juno, will slingshot around Earth on its way to Jupiter, eventually reaching a speed of 165,000 m/h. The NASA space shuttle reaches speeds of 17,000 m/h (27,000 km/h).
The average human walking speed is 3.1 m/h (5.0 km/h).
Though we sit in this coordinated maelstrom, we can still understand all of space and time on the largest scales. But, to do so, we must consider it statistically, on the whole, at great breadth and as a collection – not merely the sum of disconnected parts or separate events.
All across the universe, there are supernovae – exploding stars that blink in a cataclysmic, cosmically infinitesimal moment. Quasars are small regions that surround the supermassive black holes at the centers of galaxies that flash on and off on the timescales of hours to months. Each galaxy in the universe is creating some dimple in space-time due to its mass. Imagine a vast expanse of sand dunes: all light passing by these galaxies must traverse through it, resulting in distorted images by the time they get to us.
These are just some of the events that go on constantly around us, without regard for our existence, as we spin round and round, imagining a static quilt of stars turning about us. And they are just some of the celestial targets that will tell us more about how fast the universe is expanding.
To better understand these events, and the acceleration of spacetime, we wait for the targets to be at a place in the sky when we can see them – when the sun is down and this part of Earth is pointed in their direction. Our targets come from a large swath of sky, one-eighth of the celestial sphere. And across this expanse, we will obtain a uniform sample of targets. The uniformity – homogeneity or constancy – is crucial: we must observe all galaxies brighter than a certain amount, and within a certain distance to have a clean, uniform sample. Otherwise, variations in that information could be misconstrued, or at best they could muddy our measurement of dark energy.
Building the collection starts with amassing a set of deep images of the sky: these are but snapshots of long-gone eons, and they are the first step in our process of discovery. From the images, we distill vast catalogs of celestial bodies – galaxies, stars, motes and seas of hot gas and dust – an accounting of what the universe has so far created. This catalog can be further distilled when studied as a whole. The final concentrate is a small set of numbers that summarizes the fate of our universe: a measurement of the strength of dark energy.
Our spaceship Earth is a pebble in the swirling cosmic sea around us. We watch it as if we are separate, sometimes forgetting we come from it. As we look up from within our snowglobe on a mountaintop in the Chilean Andes, it becomes easier to remember that we are a conduit between the finite and the infinite.
Good night, and keep looking up.
Det. B. Nord
DECam Tracks Near-Earth Asteroid
In the early evening of February 3rd, 2014, the DES team received an urgent request for optical imaging of a Near Earth Object (NEO) on a “potentially hazardous orbit.” This asteroid had first been spotted by the NEOWISE (NEO Wide-field Infrared Survey Explorer) team. However, they had been unable to pin down its orbit. Additionally, poor weather in Hawaii and Arizona had stymied all other attempts to image this object. To make matters even worse, the asteroid was rapidly moving towards lower solar elongations which would bring it in line with the Sun and make later observations impossible.
Luckily, the Dark Energy Survey (DES) was on the scene as humanity’s best, last, and only line of defense. Cerro Tololo was enjoying some of the finest weather Chile has to offer, and DECam’s large field of view makes it an excellent instrument for tracking down errant asteroids. Soon after sunset, the Blanco 4m telescope swung towards the best guess for the asteroid’s position and DECam took five images, dithering slightly to make sure the asteroid couldn’t slip through the gaps between CCDs, DECam’s digital imaging chips.
After rapid processing, the DECam images revealed a new Apollo-class asteroid, 2014 BE63. The NEOWISE team confirmed that 2014 BE63 will cross the Earth’s orbit; however, the closest approach to Earth itself will be at a safe distance of 18 million miles.
We dark energy detectives can rest easy knowing that, in the words of Steve Kent [FNAL], “2014 BE63 poses no threat to DES observations (and no threat to Earth).
Written by Detective Alex Drlica-Wagner [DES, FNAL]
Video by Alex Drlica-Wagner
Beyond the Veil, but not Beyond Reach
When I awake each afternoon during an observing mission at the Cerro Tolo Inter-American Observatory (CTIO), I have one priority. Before I eat, before I check e-mail, before I even stretch, I step out the door and look to the west: are our skies clear? Clouds can cast a shroud over a night’s observing program for the Dark Energy Survey (DES), which is now in full swing, each night gathering a terabyte of clues to dark energy. If our view is blocked by clouds, if we’re not taking data and peering into the deep black, we’re missing precious opportunities to observe space-time’s expansion.
To mitigate this, the Dark Energy Survey has developed another tool to pierce the veil of Earth’s atmosphere: the Radiometric All Sky Infrared Camera, or RASICAM.
The video above shows RASICAM closed during the day and then open after sun-down. RASICAM sees the entire sky in the infrared wavelengths, where our eyes are blind, but the clouds show up clearly. DES scientists and engineers at the Stanford Linear Accelerator Center (SLAC) National Laboratory designed and constructed this all-seeing eye on the infrared sky, and it’s been operational at CTIO since 2011 (http://today.slac.stanford.edu/feature/2010/rasicam.asp). In future posts, we’ll look at the sky from RASICAM’s point of view.
RASICAM is critical to DES operations. We use this camera to help inform us about how many clouds are in the sky, as well as where they are. We can then adjust our observing strategy and better analyze the image data. The instrument is brought to us by Rafe Schindler, Peter Lewis and Howard Rogers. Data analyses and maintenance are performed regularly by Kevin Reil, Dave Burke, Peter Lewis and Zhang Zhang.
Occasionally, clouds may appear or rain may fall, but dark energy cannot hide from us.
Det. B. Nord
One Star Sets, Others Rise
The first season of the Dark Energy Survey is now drawing to a close. For another few weeks, we will continue to watch the sky from the summery Southern Hemisphere. After that, others in the astronomy community will take the reins of the Dark Energy Camera (DECam) until September.
Early in the season, the clouds (and occasionally rain) interrupted this work. For example, in October of 2013, late-evening skies of plum-golden hue gave us the sunsets you see in today’s picture. Even though there were cloudy nights early in the season, this was anticipated. We’re using basic climate and weather models to plan our survey, so we can still observe fruitfully when visibility isn’t the best. Moreover, we can use the data from this past year to improve our survey strategy for the coming four years.
However, the rest of the season has been great, with many nights of very little air turbulence in the atmosphere, meaning we captured very clear images. Astronomers talk about this using the term, “seeing,” which is measured in “arcseconds.” The lower the seeing, the clearer and crisper the images. At the Cerro Tololo Inter-american Observatory, typical values are near one arc-second.
Right now, our squads are sifting through and preparing these images for science, and preparing them to share with you.
In less than a month, the sun will rise on our first season, but the long nights of work will continue.
Det. B. Nord
